Insights Dashboard
Intelligent Insights
Welcome to the Insights Dashboard, your window into the dynamic world of security intelligence. Here, complex data transforms into clear, actionable insights, helping you understand the ever-evolving security landscape at a glance.
The Insights Dashboard is a 7-day view of trending data across all security categories.
Navigating Insights Trending Data
Let's walk through an example of how to use the Insights Trending Data.
Exploring the Initial View
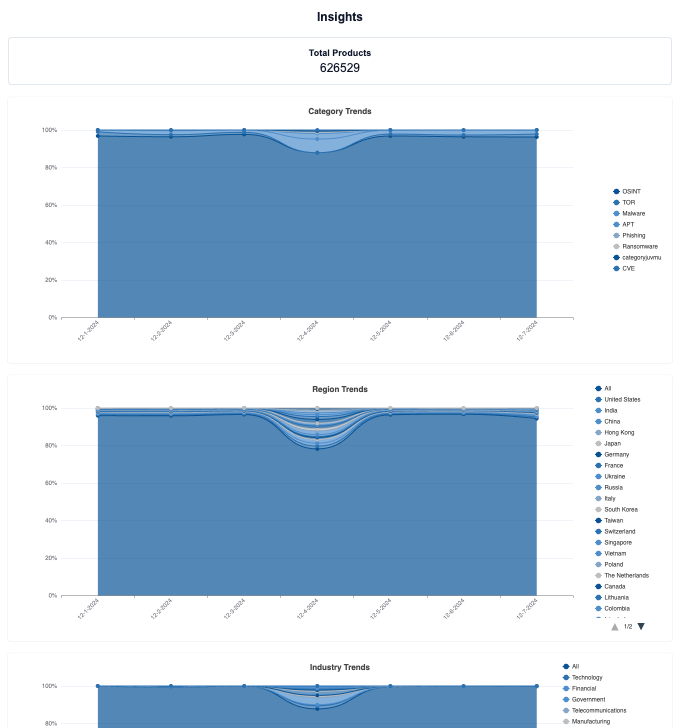
When you first land on the Insights dashboard, you'll see each of the unique Trends chart displaying their lasts trend information. This gives you a comprehensive view of how different datasets are shifting over time.
Exploring Category Data
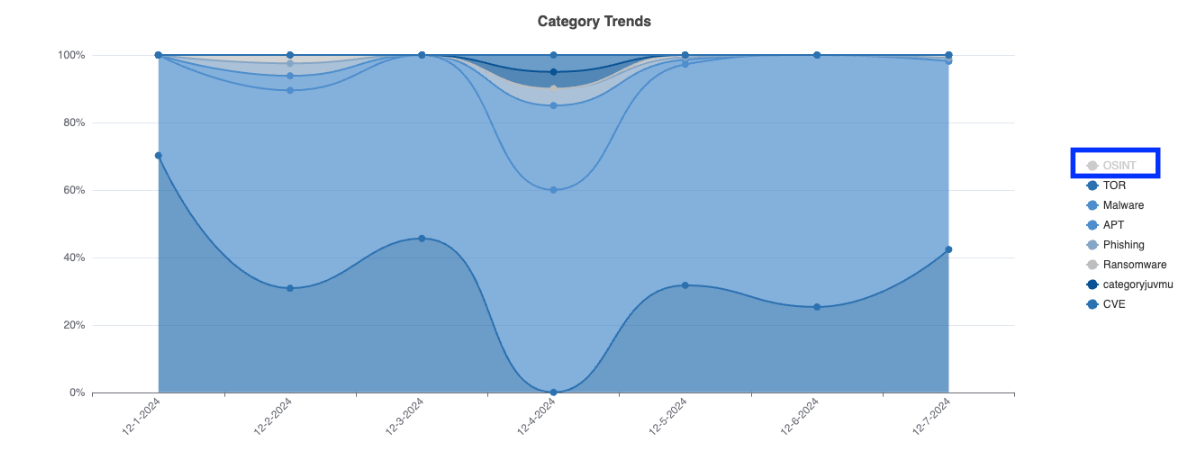
By clicking on an item, in this example, OSINT (Open Source Intelligence), we can remove or add that category from the view. Notice how the layers of data fluctuates over the 7-day period, giving you insights into:
- Peaks and troughs in Category activity
- Relative proportion of various categories compared to others
- Providing a temporal pattern to the data within the category field
Analyzing Malware Trends
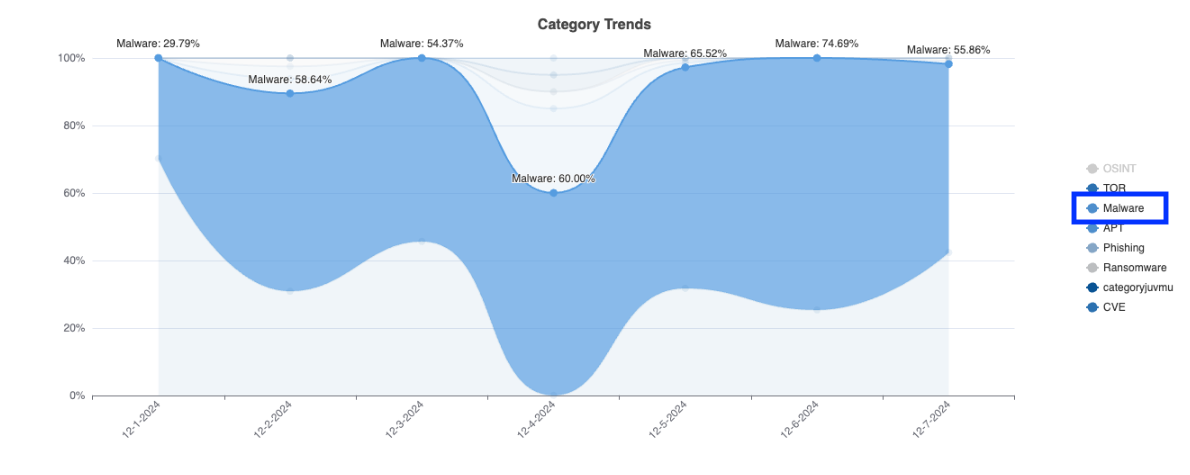
By hovering your cursor over a given legend item, we can observe only that item's trending data over the last 7 days:
- Malware related items increased by roughly 5% each day from from 12/4/2024 to 12/6/2024
- The percentage of malware-related intelligence varying from 29.79% to 74.69% over the last 7 days
- Clear patterns of malware activity are visible across each day of activity
Identifying Key Data Points
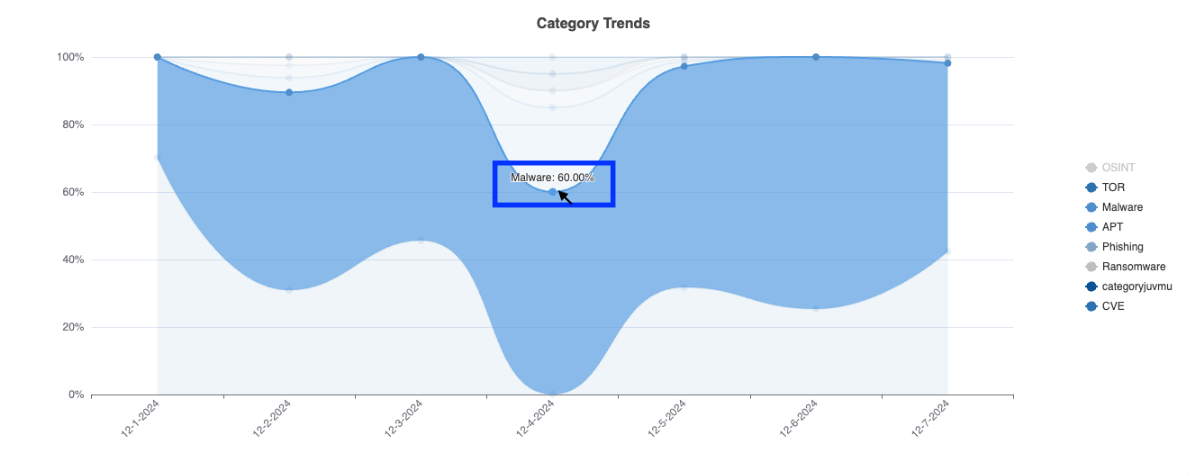
By hovering over specific day value points, you can:
- See exact percentages for that item on that day
- Identify precise timestamps for significant events
- You can also double-click that node and add that category item to the Filters panel.
Applying Filters

Once a particular item is filtered, we navigate to the Products section to see the detailed intelligence for that item:
- Use the Filters panel to select categories of interest
- In this case, we've filtered to show only Malware-related intelligence
- This filtered view can be carried over to the Products section for detailed analysis
Interactive Analysis Tips
Making the Most of Visualizations
Making the Most of Visualizations
- Hover and Click: Interact with data points to reveal detailed information
- Time Navigation: Identify specific dates of activity
- Category Toggle: Click legend items to show/hide specific categories
- Filter Combinations: Combine multiple filters for complex analysis
Pattern Recognition
Watch for:
- Sudden spikes in activity
- Correlations between categories
- Cyclical patterns
- Long-term trends
Pro Tips for Daily Analysis
- Start with the full view to get context
- Look for intersections between different categories
- Save important filter combinations
- Track daily changes in key categories
- Use the percentage indicators to gauge severity
Remember, the Insights Dashboard is your first step in understanding the security landscape. Use these visualizations to guide your investigation and inform your security decisions.